Connected Networks
Link entities with connections to create network visualizations, directed graphs, and relationship diagrams.
Brightness-Based Networks
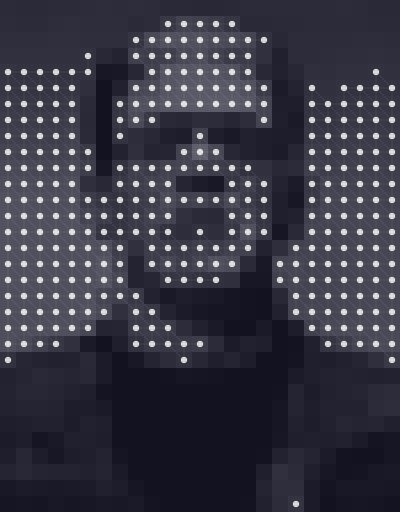
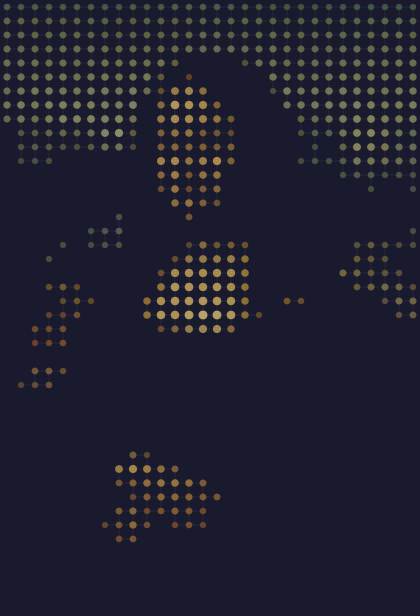
Connect dots that appear in bright areas of an image:
dots = {}
for cell in scene.grid:
    if cell.brightness > 0.35:
        dot = cell.add_dot(radius=0.15 + cell.brightness * 0.20, color=cell.color, opacity=0.7)
        dots[(cell.row, cell.col)] = dot

conn_style = PathStyle(width=0.5, color=colors.line, opacity=0.3)
for (r, c), dot in dots.items():
    for dr, dc in [(0, 1), (1, 0)]:  # right and down neighbors
        key = (r + dr, c + dc)
        if key in dots:
            dot.connect(dots[key], style=conn_style)
Distance-Based Connections
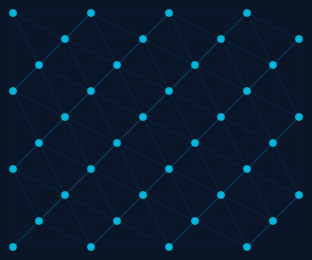
Only connect dots within a distance threshold, with opacity fading by distance:
keys = list(dots.keys())
for i, key1 in enumerate(keys):
    cell1 = scene.grid[key1[0]][key1[1]]
    for key2 in keys[i + 1:]:
        cell2 = scene.grid[key2[0]][key2[1]]
        dist = cell1.distance_to(cell2)
        if dist < 80:  # only link dots that are close
            dots[key1].connect(dots[key2], style=PathStyle(
                width=0.5 + (1 - dist / 80) * 1.5,
                color=colors.secondary, opacity=0.6 * (1 - dist / 80),
            ))
Directed Graphs with Arrows
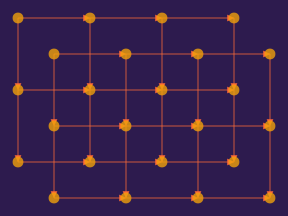
Use end_cap="arrow" for directional connections:
arrow_style = PathStyle(width=1.5, color=colors.primary, opacity=0.5, end_cap="arrow")
dot1.connect(dot2, style=arrow_style)
Network Overlay on Image
Combine image fills with a network visualization: